WordPress.com is a freemium service, meaning that our awesome blogging platform is provided for free to everyone, and we make money by selling upgrades. We process thousands of user purchases each week and you might expect that we know a lot about our customers. The truth is, we are still learning. In this post, we will give you some insights into how we try to understand the needs and behaviors of users who buy upgrades.
We know there are many kinds of users and sites on WordPress.com. To understand the needs of users who purchase upgrades, one would naturally analyze their content consumption and creation patterns. After all, those two things should tell us everything about our users, right?
Somewhat surprisingly, the median weekly number of posts or pages a user creates, and the median weekly number of likes and comments a user receives is zero! And I’m not talking about dormant users. These are our paying customers. There are lots of reasons for this, like static sites that don’t need to change very often, or blogs with a lower frequencies than weekly. But it doesn’t give us much data to work with. Well, let’s start with something that IS known about every user: their registration date.
Thousands of users register daily on WordPress.com. What does the day of the week on which the user registered with us say about their purchasing preferences? Is it possible that users who register during the week are more work-oriented, and users who register during weekends are more hobby oriented? To test this question, we’ll look at purchases that were made in our online store between March and September 2013.
We’ll divide the purchasing users in two groups: those who registered between Monday and Friday (let’s call them “workweek users”) and those who registered during Saturday and Sunday (let’s call them “weekend users”).
Side note: To the first approximation, we use registration GMT time to label a user as “registered on weekend” or “registered during the workweek”. We also ignore weekend differences that exist between the different countries. These are non-trivial approximations that make the analysis simpler and do not invalidate the answer to our question.
To examine the purchasing patterns of these groups let’s calculate the fraction of products purchased. For example: the most prevalent products in both categories were [domain mapping and registration](https://wordpress.com/support/domains/). These two products, that are usually bought together, are responsible for about 35% of upgrades bought by our workweek and weekend users. Let us now continue this comparison using a graph:
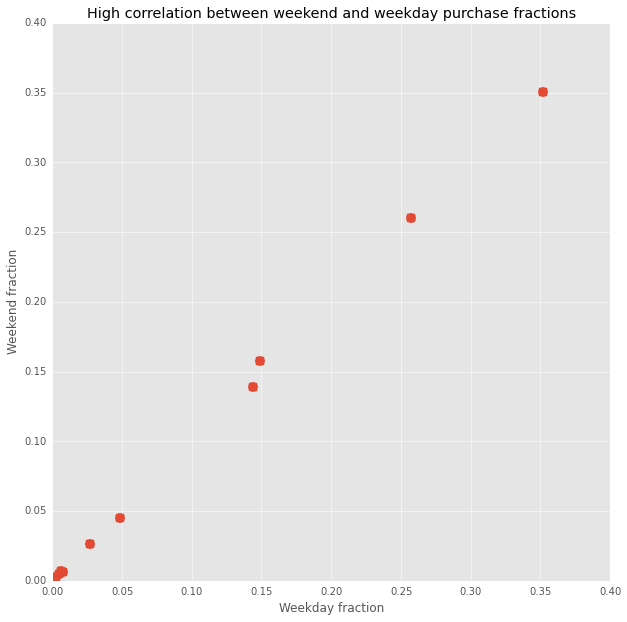
What do we learn from this comparison? Almost nothing. Which is not surprising, as purchasing distribution pattern is mostly determined by factors such as user preferences, demand, price etc.
Let’s look for more subtle differences. We’ll use a technique known as a Bland / Altman Plot. These British statisticians noted that plotting one value versus another implies that the one on the X axis is the cause and the one on the Y axis is the result. An alternative implication is that the X axis represents the “correct value”. None of these is correct in our case. We are interested in understanding the agreement (disagreement, to be more precise) between two similar measurements, when none of the two is superior over another. Thus, instead of plotting the two closely correlated metrics (purchase fractions in our case), we should plot their average values on the X axis and their difference on the Y axis. In this domain, higher X axis values designate more prevalent products, positive Y values designate preference towards the working days and negative Y values designate preference towards the weekend. This is what we get after transferring the fractions to logarithm domain:
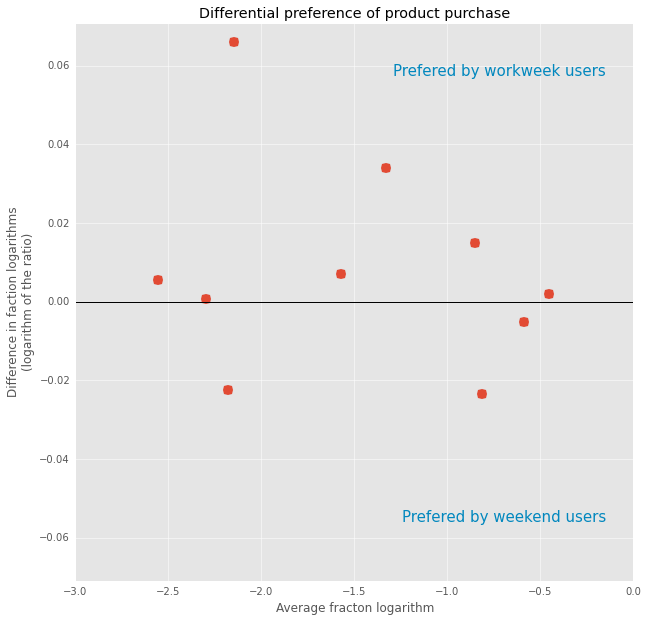
Now things become interesting. Let us take a look at some of the individual points:
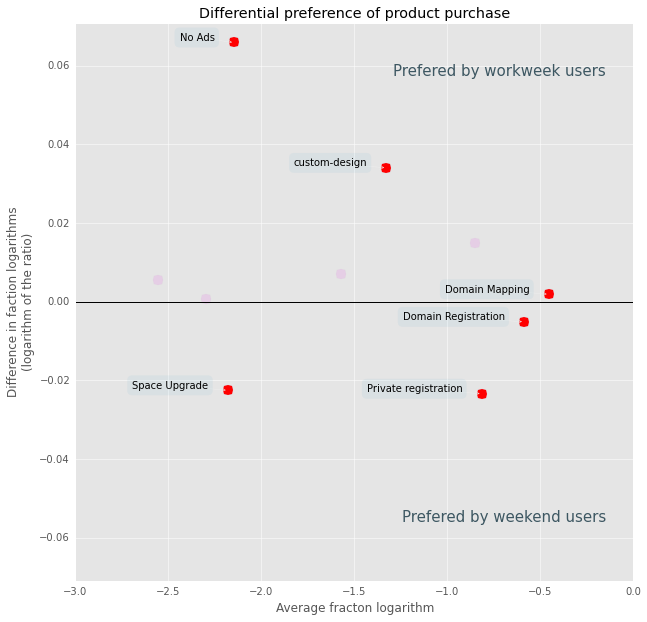
As I have already mentioned, domain mapping and registration are the most popular products. Not surprisingly, these products are equally liked by weekend and working week users. Recall our initial intuition that users who register during weekends will be more hobby-oriented and users that register during the week will be more job oriented. We now have some data that supports this intuition. Of all the products, private registration, followed by space upgrades have the strongest bias towards weekend users. Indeed, one would expect personal users to care about their privacy much more than corporate ones. Being more cost-sensitive, personal users are more likely to purchase space upgrade and not one of plans. The opposite side of the division line makes sense too: blocking ads is the cheapest option to differentiate a workplace site, followed by custom design. These two options are included in all our premium plans, but I can understand how a really small business would prefer buying some individual options.
Another note: If you are worried about statistical significance of this analysis, you are completely right. I don’t show this here, but exactly the same picture appears when we analyze data from different time periods.
So what?
As an app developer, you will at some point be frustrated about how little you know about your customers. Don’t give up! Start with the small things that you know. Things such as day of the week, geographical location and browser version may shed useful light and you can build out a picture from there, adding to it bit by bit. Having such information is like gardening: it sounds like a lot of work, but you might be surprised at what you can get from a little investment of time. With determination (asking lots of questions) and creativity (looking at a problem from new angles, starting with information you already have) and the right tools in your hands, you can learn something about your users and grow your garden of understanding.


