Today, most open source network flow tools lack a flexible and easy to use interface. Using Logstash’s built-in netflow codec, Kibana’s great looking and powerful web interface, and the flexibility of Elastic, you can build a tool that rivals commercial flow-collecting products.
Kibana – Analyzing data
Discover
Discover is the main screen in Kibana and a good place to test and build queries. You can customize the columns and time displayed, look at the top n of each field in the left column, and open the flow record to see its complete details. From here you can save searches or create queries and pin them to use later in visualizations.

Visualize
There are many ways to present your data in Kibana. The top three for us are line charts, pie charts, and map views. There are a few few other visualizations as well.
Line charts are great for displaying bytes per second (bps) or packets per second (pps) over time. The line graph below shows total bps for the matched country (Poland) over the past 5 days. When you choose per-second aggregation, Kibana may change your aggregate values, but it still does the math to give you the correct per second value.
Pie charts are well suited for showing data relative to the entire result set. There can even be multilayered data on the chart. The inner layer of the pie chart below shows relative traffic per country. The outer layer represents the different WordPress.com data centers where the traffic was received.
The map is useful to see how anycast routing is performing. In the map below, the query matches Sydney data center for traffic over the past 24 hours. You can see a few spots in North America. In this case, the cause is international networks that don’t have correct geolocation info on their IP addresses. The map data is only as good as the geolocation source.
There are many other visualization options and the only limit is your imagination!

Bytes per second to Poland

Traffic by country

Anycast traffic in Sydney
One real-world example of the visualizations working together is to identify networks that aren’t routing traffic to the nearest data center. In the past, we’ve found networks peering with foreign route servers and preferring those routes instead of using much closer data centers. Using the Kibana map, we can select a problematic geographical area and create a filter focused on just the specific sources. The query is then used in a pie chart, showing you the top source ASNs and some example source/destination IPs. Filtering further, you can create a line chart to determine how many Mbps could potentially move to another, closer, PoP. This is just one of nearly limitless use cases of collecting and analyzing your netflow data with ELK.
Dashboard
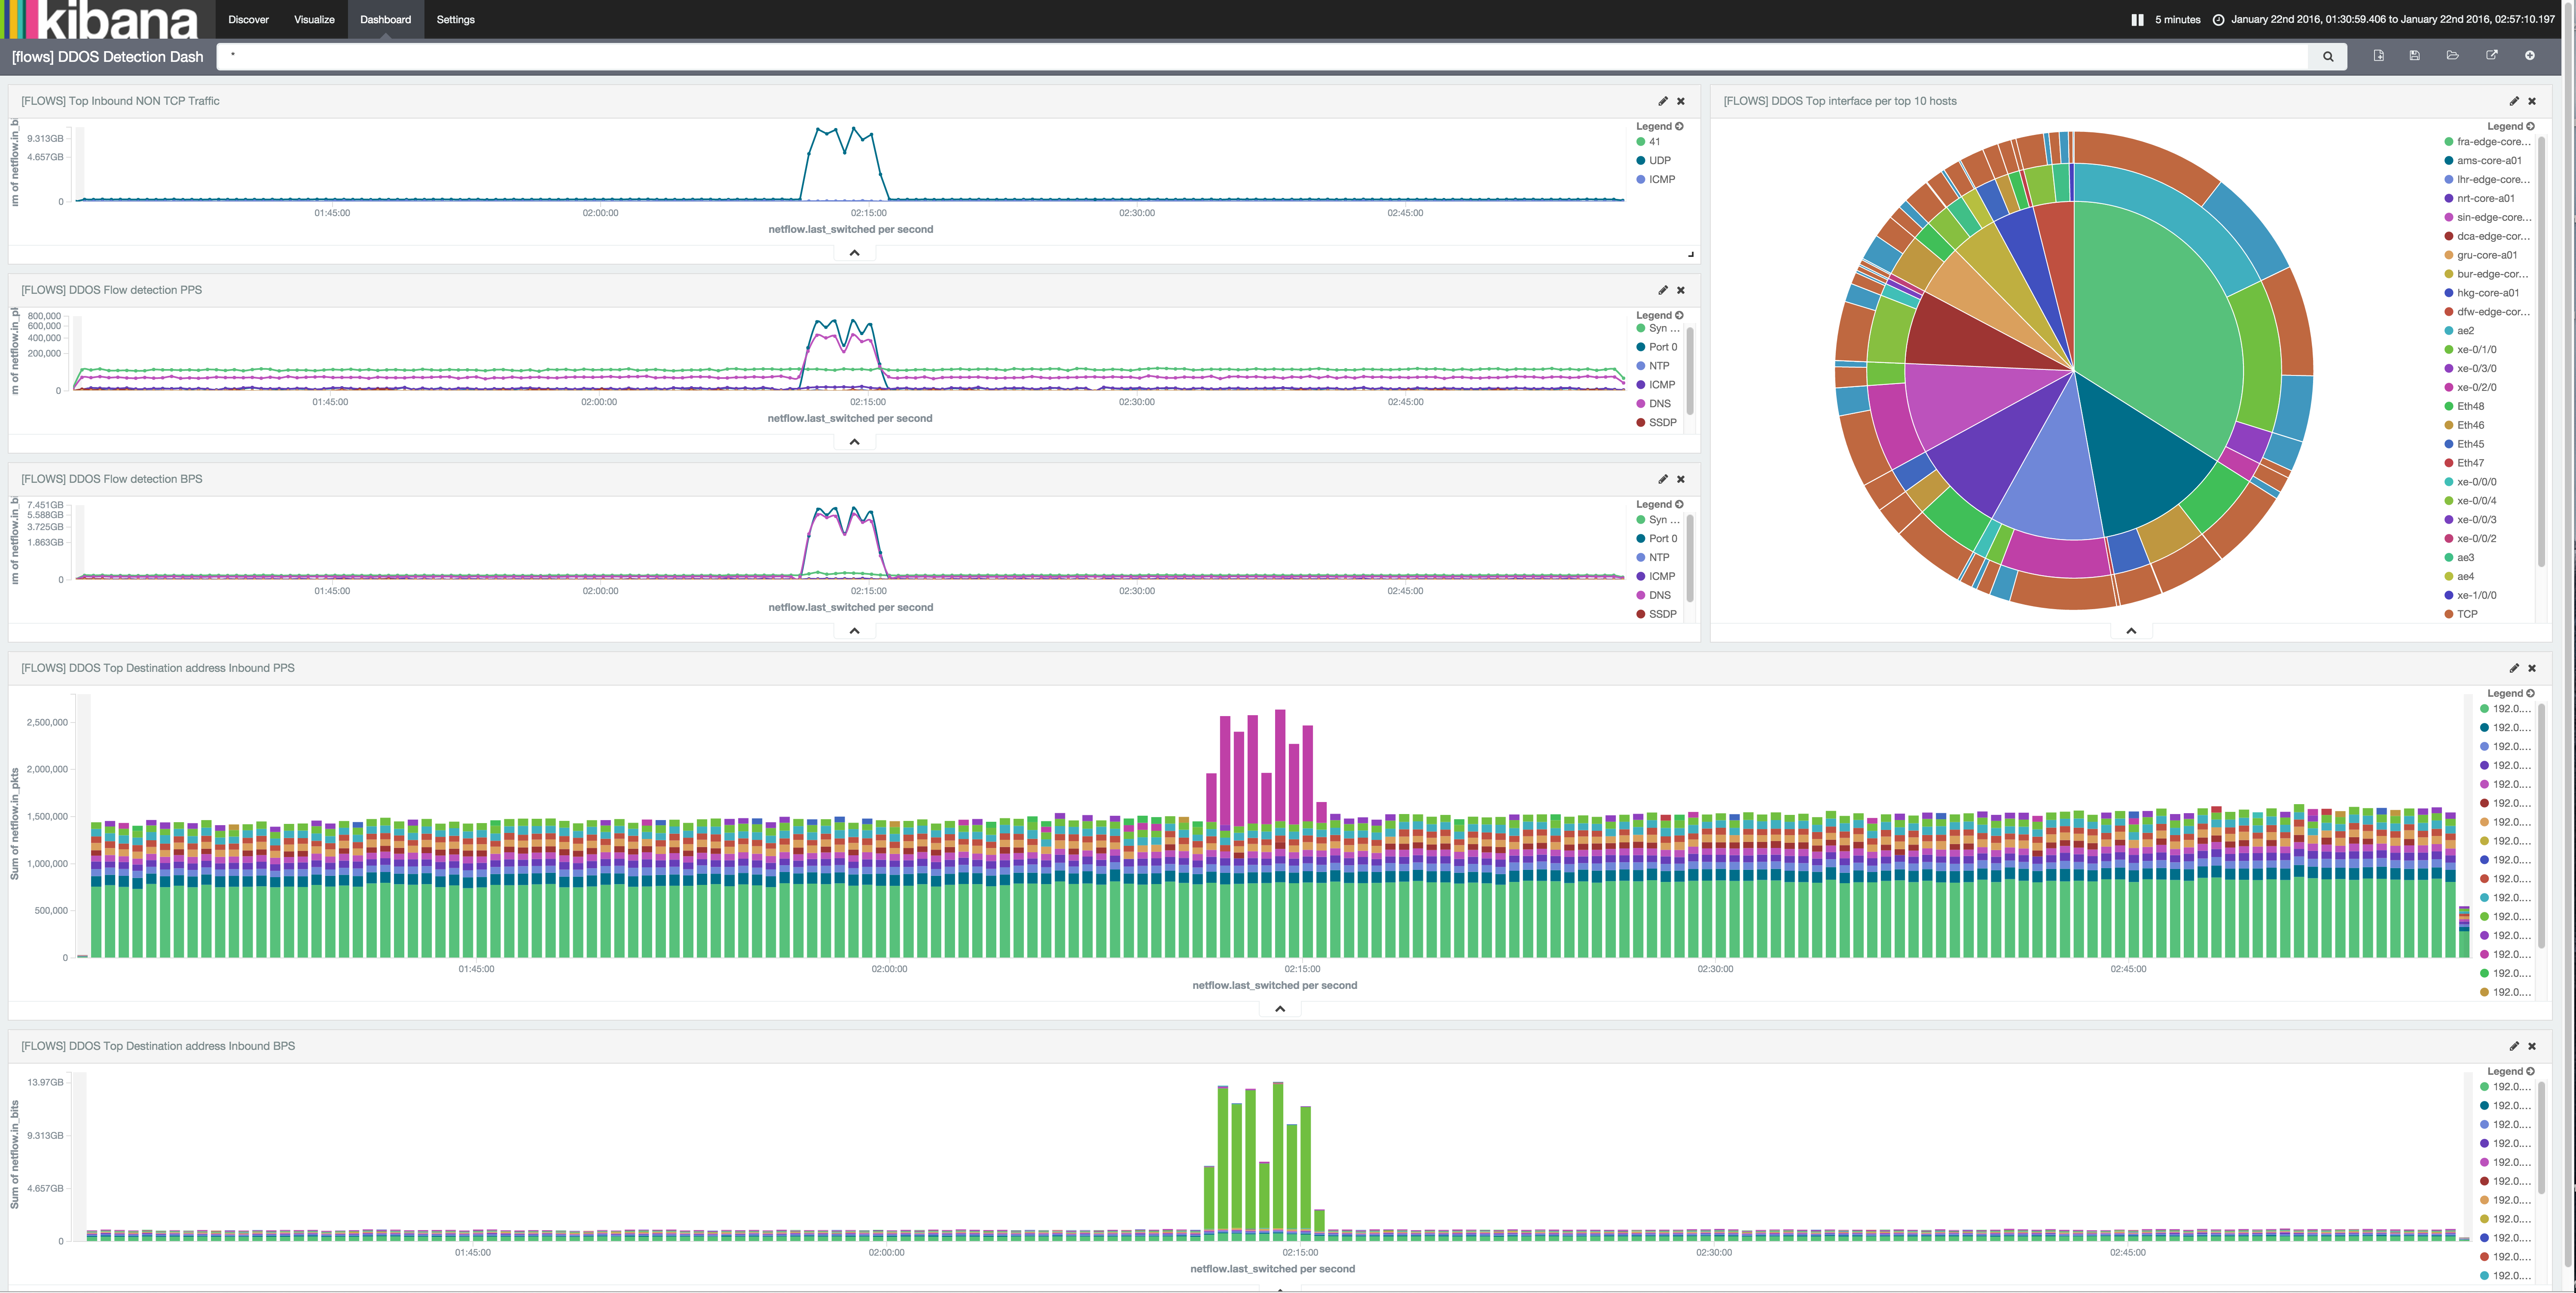
It is fun and useful to set up different views in your network by having multiple complimenting charts on your screen. We’ve setup a Denial of Service dashboard that tracks spikes in suspicious traffic, such as DNS, SYN floods, NTP, or any other UDP spikes.

In this example there was a spike in UDP traffic. We highlighted the area to zoom in on that period in time. Kibana then redraws the results of all of the charts in the dashboard for that time period which allows us to see details of the traffic spike. We see what routers and interfaces that received the majority of the traffic on the pie chart. The inner layer of the pie chart represents a router, the mid area represents attached interfaces to each router and the outer area of the pie chart represents UDP vs TCP on a given interface. We can see the blue, representing UDP, appear on the dashboard below.
Logstash – Collecting the data and help make it useful
Config
The configuration for Logstash can be as simple as just adding an input of the netflow codec and an output of Elastic. Logstash has many powerful filters that can be combined with conditional statements to add value and readability to your data. Here are a few examples of filters in action:
# Private ASN is actually AS2635
	if [netflow][dst_as] < "65535" and [netflow][dst_as] > "64511" {
		mutate {
			replace => { "[netflow][dst_as]" => "2635" }
		}
	}
# Multiply by sampling interval to calculate the total bytes and packets the flow represents
if [netflow][sampling_interval] > 0 {
	ruby {
		code => "event['netflow']['in_bytes'] = event['netflow']['in_bytes'] * event['netflow']['sampling_interval']"
		add_tag => [ "multiplied" ]
	}

	ruby {
		code => "event['netflow']['in_pkts'] = event['netflow']['in_pkts'] * event['netflow']['sampling_interval']"
	}
}

# add a bits field
if [netflow][in_bytes] {
	ruby {
	code => "event['netflow']['in_bits'] = event['netflow']['in_bytes'] * 8"
	}
}
#Protocol friendly naming
translate {
field => "[netflow][protocol]"
destination => "[netflow][protocol]"
override => "true"
dictionary => [ "6", "TCP", "17", "UDP", "1", "ICMP", "47", "GRE", "50", "ESP" ]
}
# get the datacenter from hostname
translate {
field => "host"
destination => "datacenter"
dictionary => [
"hostname", "citycode",
...]
}
Translate to add friendly names instead of all numbers, such as, tcp flags, tcp/udp ports, interface names and hostnames.
if [host] == "hostname" {

translate {
field => "[netflow][input_snmp]"
destination => "[netflow][interface_in]"
dictionary => [ "633", "xe-1/0/0" ]
add_field => {
direction => "inbound"
traffic_type => "transit"
provider => "ntt"
}
}

translate {
field => "[netflow][output_snmp]"
destination => "[netflow][interface_out]"
dictionary => [ "633", "xe-1/0/0"]
add_field => {
direction => "outbound"
traffic_type => "transit"
provider => "ntt"
}
}
The filters can be used to add the GeoIP data, ASN including network name which is useful for routers that don’t have full BGP table.
if "inbound" == [direction] {
geoip {
database => "/home/logstash/config/GeoLiteCity.dat"
source => "[netflow][ipv4_src_addr]"
target => "geoip_src"
}
CIDR to tell Logstash about prefixes that have special meanings.
# Tag Interesting traffic by prefix
cidr {
add_field => { "interesting" => true }
address => [ "%{[netflow][ipv4_src_addr]}", "%{[netflow][ipv4_dst_addr]}" ]
network => [ "100.0.0.0/24" ]
}
Sflow
Logstash does not have a native sflow collector, so we used Sflow tool to convert sflow to netflow. Another option is to parse the text output of Sflow tool as a pipe input to Logstash and set up the fields using the grok filter.
The future
IPv6/IPFIX/NetflowV9
Kibana supports NetflowV9 which can include IPv6 addresses and send flow data more efficiently. There is a patch for IPFIX with support being added soon. There are still some things being worked out, for example the GeoIP database filter doesn’t work with IPv6. This creates some filtering limitations, especially if you don’t have a full routing table router and want to group traffic by ASN or location.
Alerting
This is a new system for us and we are still tweaking and getting used to the data, so alerting is not yet configured. Alerting is definitely an important part of network monitoring. Using flow data to trigger alerts can go well beyond the limitations of SNMP queries and traps. Some have made their own scripts to query Elastic(search), match the response with a threshold value, and then alert if it’s exceed. There are even plugins for Nagios that can query Elastic, parse the response and trigger an alert if required. Elastic.co also has a paid tool called Watcher that can serve this purpose.


