One benefit to WordPress.com’s managed WordPress hosting is that you never have to worry about configuring the server. No Nginx tweaks, restarting PHP processes, or optimizing the MySQL configuration — we take care of that for you.
It doesn’t need to be a total black box, though! For WordPress.com Business and Commerce sites with hosting features enabled, our new Site Monitoring page gives you visibility into the power running under the hood.
Explore the Site Monitoring page
Our Site Monitoring page strives to make it easy to understand how your site is performing, without overwhelming you with data. To access it, simply navigate to your site’s dashboard, select the “Tools” item in the sidebar menu, and click on the “Site Monitoring” link. You’ll see the server metric charts by default, with easy access to PHP and webserver logs for deeper analysis.
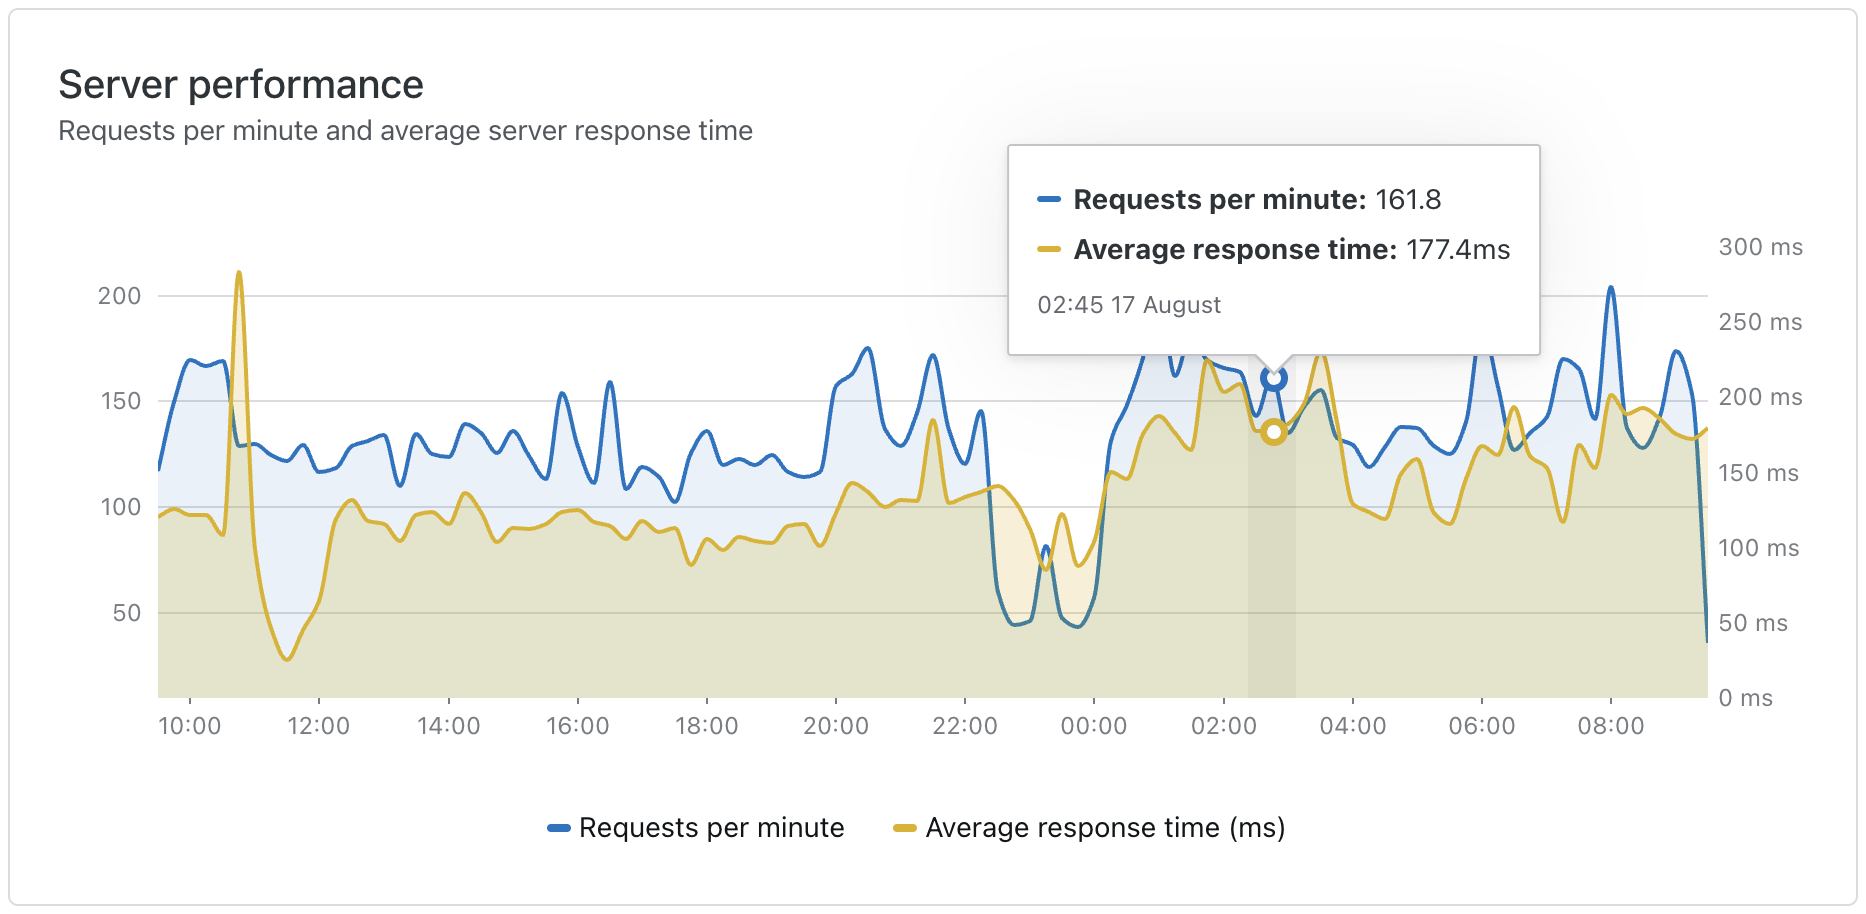
The Server Performance chart on the Site Monitoring page showcases two key metrics:
- Requests per minute, or how many HTTP requests your site is receiving per minute.
- Average response time, or how long it takes your site to prepare and respond to the request.
The combination of these two metrics can show you how your site performs under load. When requests per minute spike, does the average response time spike as well?
Fortunately, WordPress.com Business and Commerce sites have automated burst scaling. When your site receives a burst of traffic, our custom resource management system automatically scales your WordPress.com site to over 100 PHP workers.
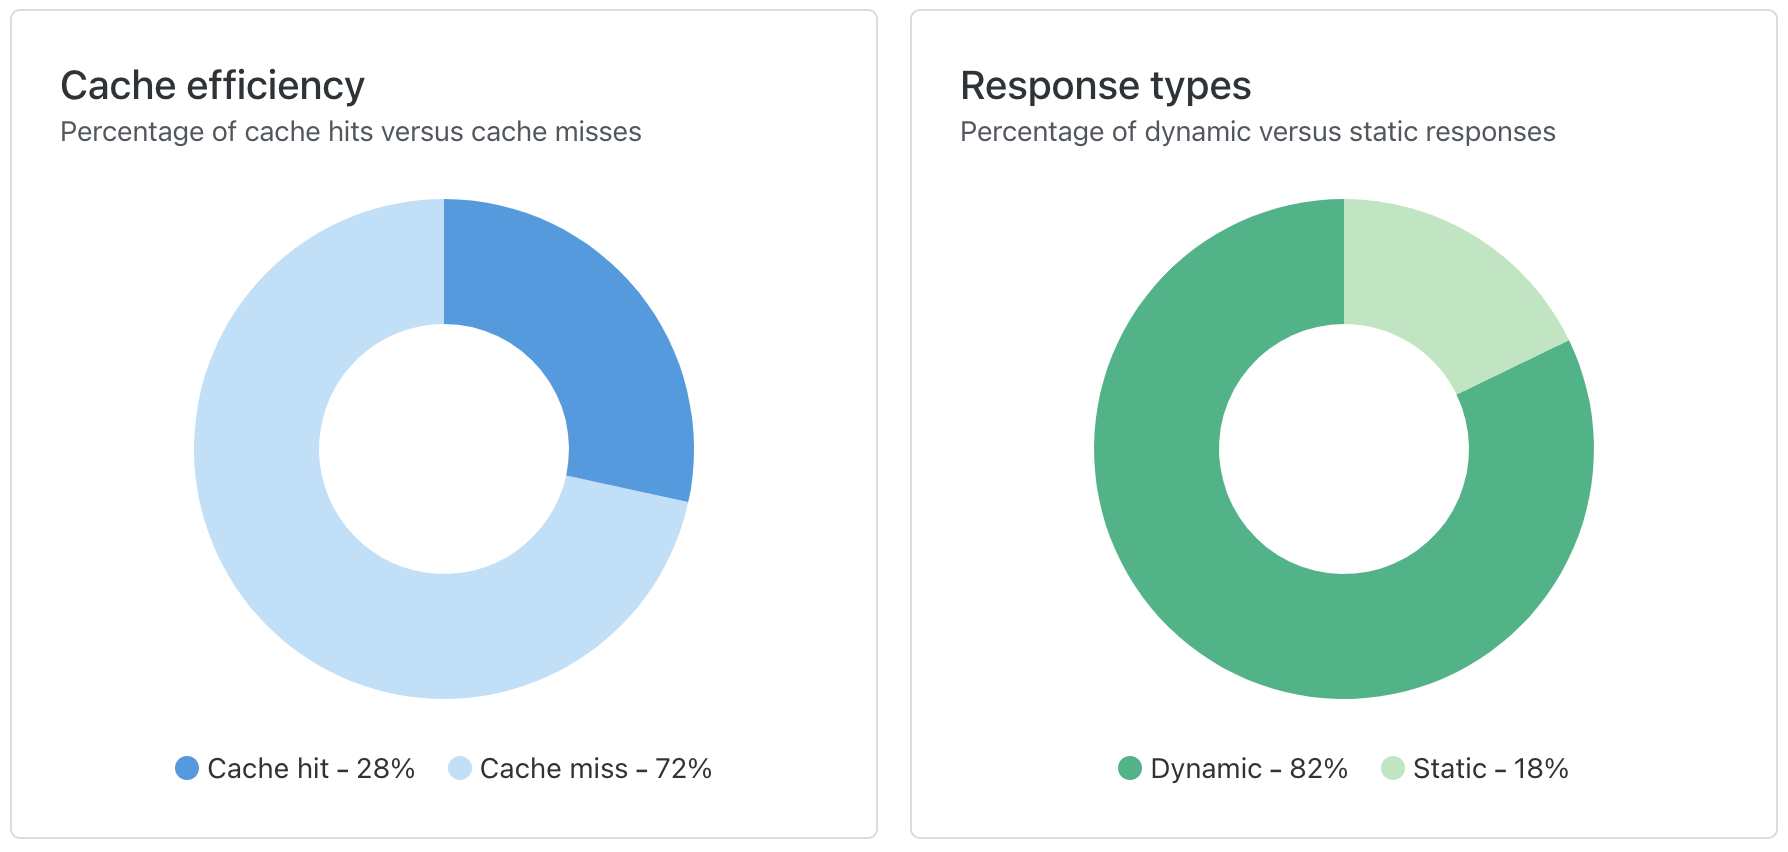
The Cache Efficiency chart shows you how many requests are hitting cache, versus how many are bypassing the cache and hitting the server. More cache hits is better — it means faster load times, less waiting, and a better overall experience.
Say your website is hosted at our data centers in Texas and a visitor from Cape Town wants to access it. The request from the visitor has to travel halfway around the world and back again.
With our Global Edge Cache feature enabled, a hot cache means the request only needs to travel to Johannesburg and back, saving your visitor tens or even hundreds of milliseconds. It may not seem like much, but when you’re online, every millisecond counts.
Right next door, the Responses Types chart focuses on the balance between dynamic and static responses on your site. When you spot a lot of dynamic responses alongside fewer static ones, it is likely that your site is generating fresh content in response to user requests what’s stored in the database.
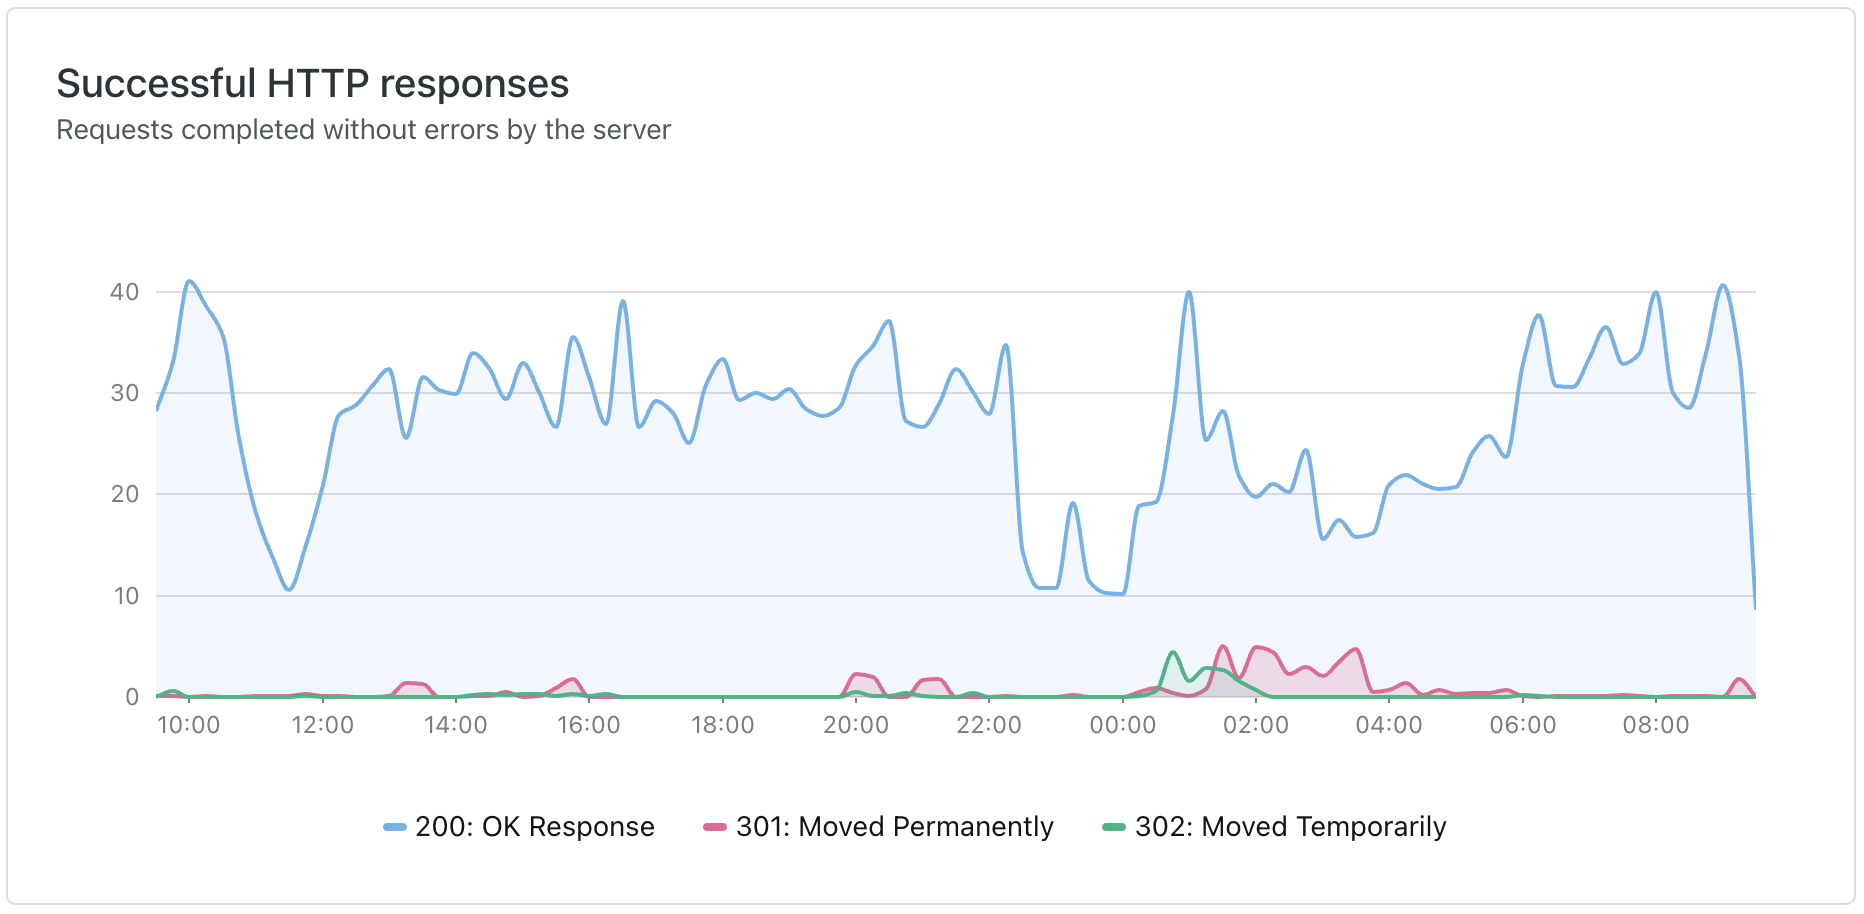
The last two charts focus on successful and unsuccessful HTTP responses. This data helps is all about understanding how well your resources are being delivered and how URLs are getting handled on your website. It is like getting a backstage pass to resource management!
Successful responses are the requests that are smoothly processed. Here are the success response codes you might see, as explained by ChatGPT:
- 200: Perfect performance, you’re in the front row! 🎤 👏
- 301: The band’s changed venues… for good! 🎪 ➡️ 🏟️
- 302: Temporary stage change, follow the tour guide! 🚩 🚶♂️
Unsuccessful responses are those moments when requests hit a snag or encounter issues in their journey:
- 400: Huh? Your song request is out of tune! 🎶 ❌
- 401: No backstage pass, no entry! 🎟️ 🚫
- 403: VIP-only jam session! 🎸 🔒
- 404: Setlist not found. Did the drummer take it? 🥁 ❓
- 500: Technical difficulties, the amp exploded! 🔊 💥
Build Your Next Site on WordPress.com
Making it easy to understand your site’s server metrics is just one more reason WordPress.com is the best managed WordPress hosting on the planet. Whether it’s global edge cache, staging sites, SSH and WP-CLI access, or centralized site management, we’re constantly adding new tools to make WordPress.com an indispensable part of your workflow.
Follow this Developer Blog to keep up with all the latest announcements, or leave a comment with any new features you’d like to see. A special thanks to Leon Sorokin for the fantastic uPlot charting library.


