For developers working with the REST API, the browser-based API console is an essential debugging tool. It allows you to test your API queries and interactively explore the results (or errors) that the API returns.
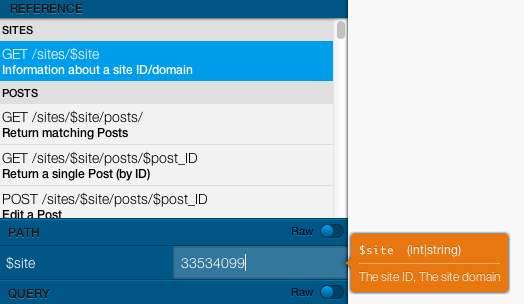
It also puts the documentation at your fingertips and allows you to build a custom query right from any method’s description.
Like the REST API itself, this tool works for any blog on WordPress.com and for any self-hosted WordPress install using Jetpack.
With the addition of implicit OAuth, we’ve released an open-source version of the API console that you can run yourself.
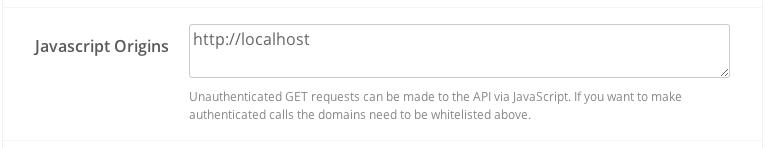
First, you’ll want to create a WordPress.com application (or modify an existing one) and make sure to set the Javascript Origins option. This should be the fully-qualified URL (including http:// or https:// ) of the site you’ll be running the API console on. To run it locally, just use “http://localhost”.
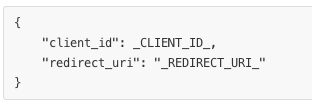
Then, just head on over to the GitHub repository, clone your own copy, and put your application’s info in the file config.json.
When you’re running the console locally, you can authenticate by clicking on the box in the lower-right corner.

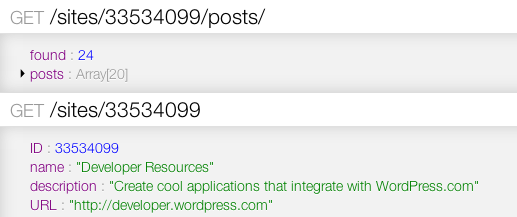
Once you’re linked to a blog, the blog’s ID will be shown in the lower right. You can click on it to change which blog you’re working with.
Important note: When you’ve connected to a blog, the console is hooked up to the live database — any changes you make will be reflected on that blog! You might want to create a test blog if you’re planning to make any requests that will modify content.
The REST API console is located at https://developer.wordpress.com/docs/api/console/.
If you’re using the API, we’d love to hear what you think! Have you used the development console? What’s great (or not so great) about it?


